
Tree based classification on Titanic data
- 31 minsTree based classification
I am evaluating models on Titanic data acquired from Kaggle. Here I am applying the DecisionTreeClassifier from sklearn package and showing how it performs.
from sklearn.model_selection import train_test_split
from sklearn.tree import DecisionTreeClassifier, export_graphviz
from sklearn.metrics import roc_curve, roc_auc_score
import pandas as pd
import numpy as np
data = pd.read_csv("titanic.csv")
data.head(n=4)
| PassengerId | Survived | Pclass | Name | Sex | Age | SibSp | Parch | Ticket | Fare | Cabin | Embarked | |
|---|---|---|---|---|---|---|---|---|---|---|---|---|
| 0 | 1 | 0 | 3 | Braund, Mr. Owen Harris | male | 22.0 | 1 | 0 | A/5 21171 | 7.2500 | NaN | S |
| 1 | 2 | 1 | 1 | Cumings, Mrs. John Bradley (Florence Briggs Th... | female | 38.0 | 1 | 0 | PC 17599 | 71.2833 | C85 | C |
| 2 | 3 | 1 | 3 | Heikkinen, Miss. Laina | female | 26.0 | 0 | 0 | STON/O2. 3101282 | 7.9250 | NaN | S |
| 3 | 4 | 1 | 1 | Futrelle, Mrs. Jacques Heath (Lily May Peel) | female | 35.0 | 1 | 0 | 113803 | 53.1000 | C123 | S |
# Fill age with mean because only some are missing
data['Age'] = data['Age'].fillna(data['Age'].dropna().mean())
# Set NaN for Cabin to Unknown because if it would be dropped we would loose ~70% of data
data['Cabin'] = data['Cabin'].fillna('Unknown')
# For any other let's drop the record
data = data.dropna()
gender = set(data['Sex'].values)
gender = dict(zip(gender, range(len(gender))))
gender
data['Sex'] = data['Sex'].map(lambda value: gender[value])
# It was shown in the previous homework that these values are the important metrics.
X = data[['Pclass', 'Sex', 'Age', 'SibSp', 'Parch', 'Fare']]
y = data['Survived']
X_train, X_test, y_train, y_test = train_test_split(X, y, test_size=.2, random_state=42)
import graphviz
from IPython.display import Image
!conda install pydotplus -y
import pydotplus
Solving environment: done

...

An unexpected error has occurred. Conda has prepared the above report.
Upload successful.
clf = DecisionTreeClassifier(max_leaf_nodes=50).fit(X_train, y_train)
dot_data = export_graphviz(clf, out_file=None,
                          filled=True, rounded=True,
                special_characters=True, feature_names=['Pclass', 'Sex', 'Age', 'SibSp', 'Parch', 'Fare'])
graph = pydotplus.graph_from_dot_data(dot_data)
Image(graph.create_png(), width=1700, height=1800)
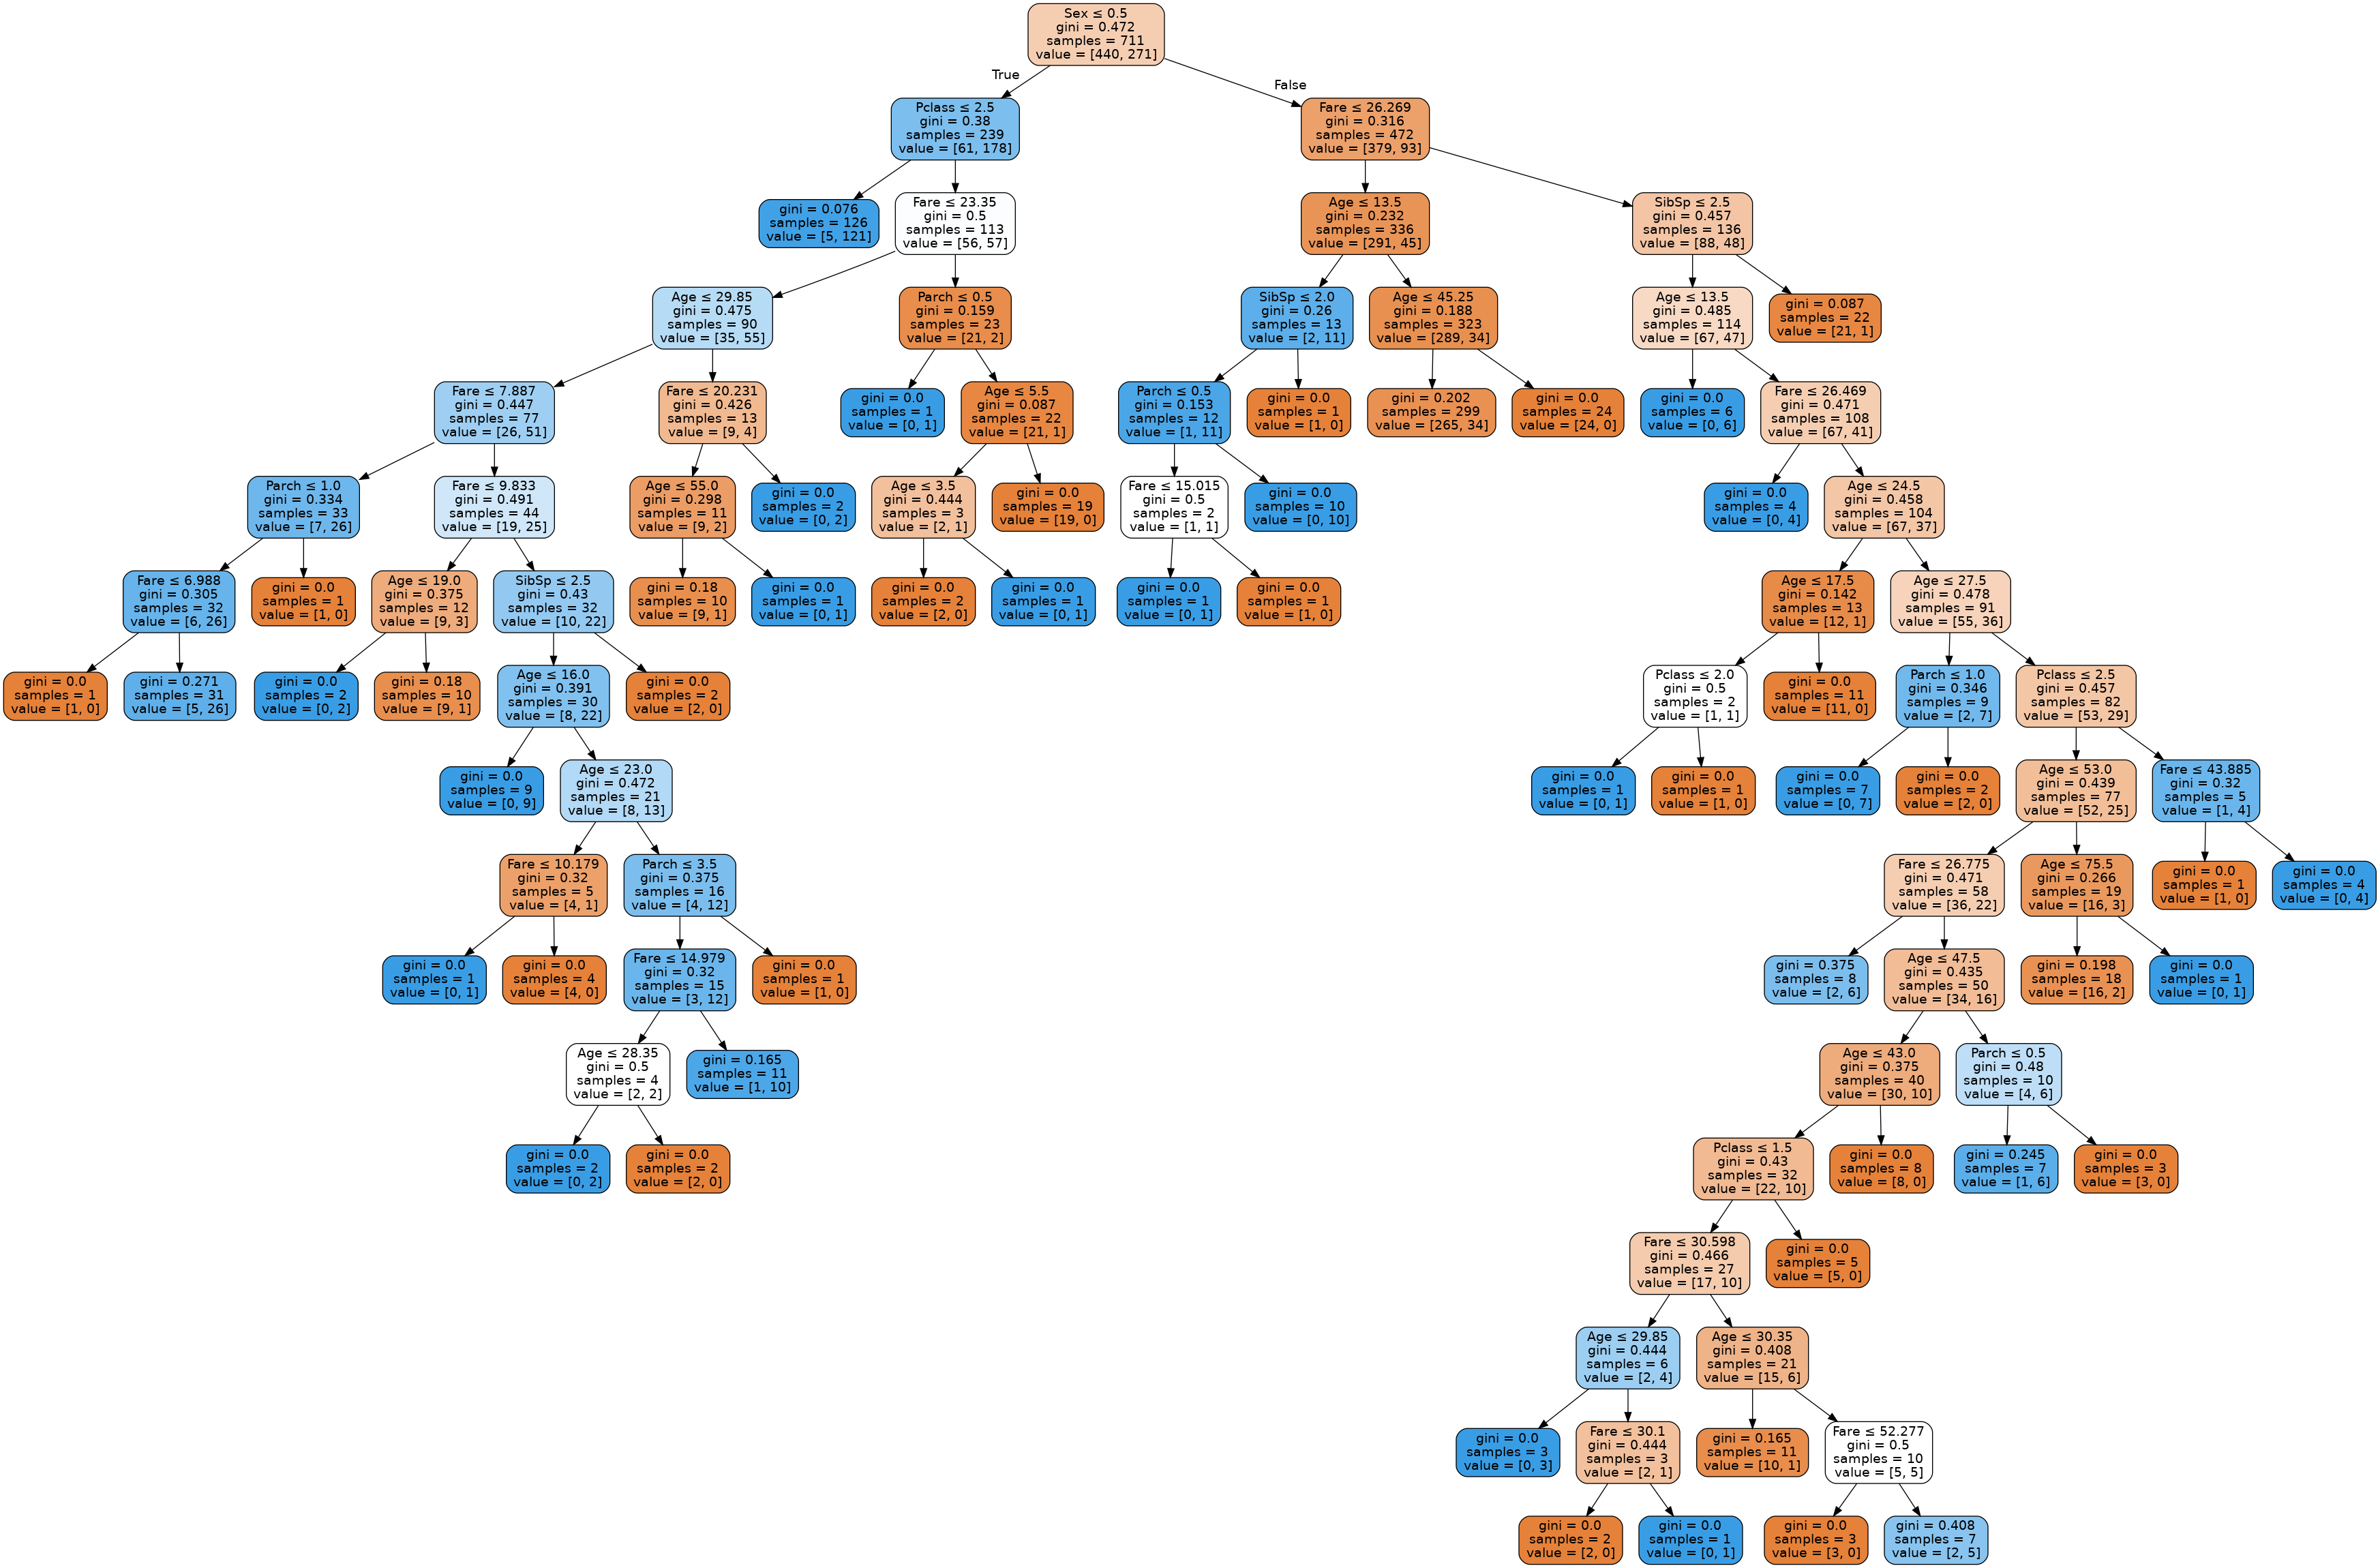
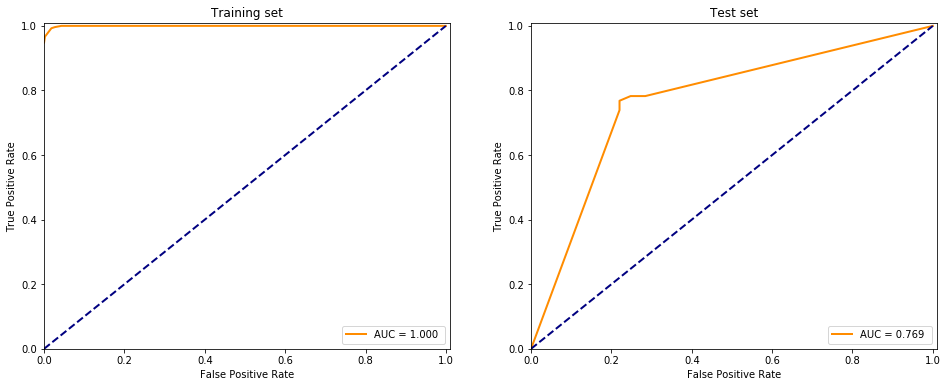
The first split is done on gender and after that the splits are done differently in the two subtrees. Fare and age play and important role, since they are major splits on almost every node in the tree.
pred_train = clf.predict_proba(X_train)
pred_test = clf.predict_proba(X_test)
import matplotlib.pyplot as plt
plt.figure(figsize=(16, 6))
plt.subplot(121)
fpr, tpr, _ = roc_curve(y_train, pred_train[:, 1])
lw = 2
plt.plot(fpr, tpr, color='darkorange',lw=lw, label="AUC = %.3f " % roc_auc_score(y_train, pred_train[:, 1]))
plt.plot([0, 1], [0, 1], color='navy', lw=lw, linestyle='--')
plt.xlim([0, 1.01])
plt.ylim([0, 1.01])
plt.xlabel('False Positive Rate')
plt.ylabel('True Positive Rate')
plt.legend(loc="lower right")
plt.title("Training set")

plt.subplot(122)
fpr, tpr, _ = roc_curve(y_test, pred_test[:, 1])
lw = 2
plt.plot(fpr, tpr, color='darkorange',lw=lw, label="AUC = %.3f " % roc_auc_score(y_test, pred_test[:, 1]))
plt.plot([0, 1], [0, 1], color='navy', lw=lw, linestyle='--')
plt.xlim([0, 1.01])
plt.ylim([0, 1.01])
plt.xlabel('False Positive Rate')
plt.ylabel('True Positive Rate')
plt.legend(loc="lower right")
plt.title("Test set")

plt.show()
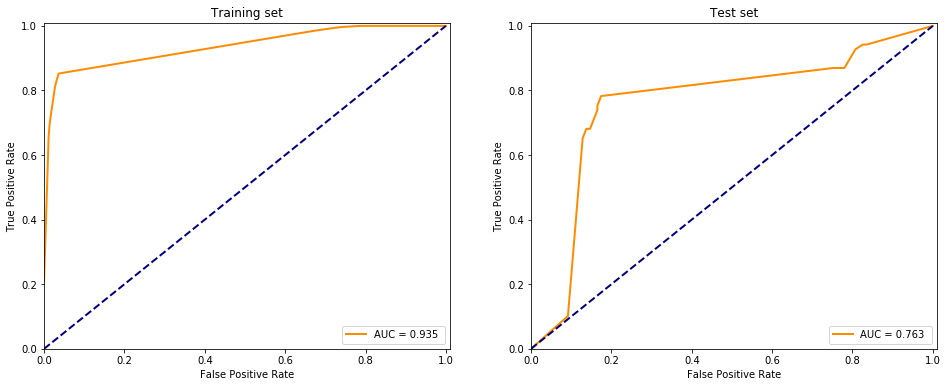
It is evident that the classifier pretty much learned the dataset and classified everything correctly whilst it is performing pretty bad on the test set compared to the training data.
from sklearn.model_selection import KFold
from sklearn.metrics import mean_squared_error
Checking the error during cross validation it can be seen that from 10-60 leaves the test error remains almost the same while the training error constantly decreases. The latter can be explained by the model memorizing the training data.
def dectree_cv_err(X, folds=5, minLeaves=2, maxLeaves=50):
    kf = KFold(n_splits=folds, random_state=42, shuffle=True)
    error = []
    std_error = []
    train_err = []
    train_std_err = []
    auc = []
    err_auc = []
    for leaf_size in range(minLeaves, maxLeaves + 1):
        cross_err = []
        train_cross_err = []
        cross_auc = []
        for train_index, test_index in kf.split(X):
            X_train, X_test = X.values[train_index], X.values[test_index]
            y_train, y_test = y.values[train_index], y.values[test_index]
            clf = DecisionTreeClassifier(max_leaf_nodes=leaf_size).fit(X_train, y_train)
            pred_test = clf.predict(X_test)
            pred_train = clf.predict(X_train)
            cross_err.append(mean_squared_error(y_test, pred_test))
            train_cross_err.append(mean_squared_error(y_train, pred_train))
            cross_auc.append(roc_auc_score(y_test, pred_test))
        error.append(np.mean(cross_err))
        train_err.append(np.mean(train_cross_err))
        std_error.append(np.std(cross_err))
        train_std_err.append(np.std(train_cross_err))
        auc.append(np.mean(cross_auc))
        err_auc.append(np.std(cross_auc))
    plt.figure(figsize=(14, 7))
    plt.subplot(121)
    plt.title("MSE during cross validation")
    plt.xlabel("Max leaf size")
    plt.ylabel("MSE")
    plt.errorbar(range(minLeaves, maxLeaves + 1), error, yerr=std_error, marker='s', mfc='red',
                 mec='green', ms=5, mew=1, label = "TEST", errorevery=3)
    plt.errorbar(range(minLeaves, maxLeaves + 1), train_err, yerr=train_std_err, marker='o', mfc='blue',
                 mec='yellow', ms=5, mew=1, label = "TRAIN", errorevery=3)
    plt.legend()
    plt.subplot(122)
    plt.title("AUC during cross validation")
    plt.xlabel("Max leaf size")
    plt.ylabel("AUC score")
    plt.errorbar(range(minLeaves, maxLeaves + 1), auc, yerr=err_auc, marker='o', mfc='red',
                 mec='red', ms=3, mew=2, label = "AUC", errorevery=3)
    plt.legend()
    plt.show()
    print("Leaf size %d yields the best AUC score: %.3f" % (np.argmax(auc), np.max(auc)))
The folds the cross validation is done on does not bare significance in the results. I selected the model with the best AUC score to use in the future.
dectree_cv_err(X, minLeaves=2, maxLeaves=150) # 5 folds
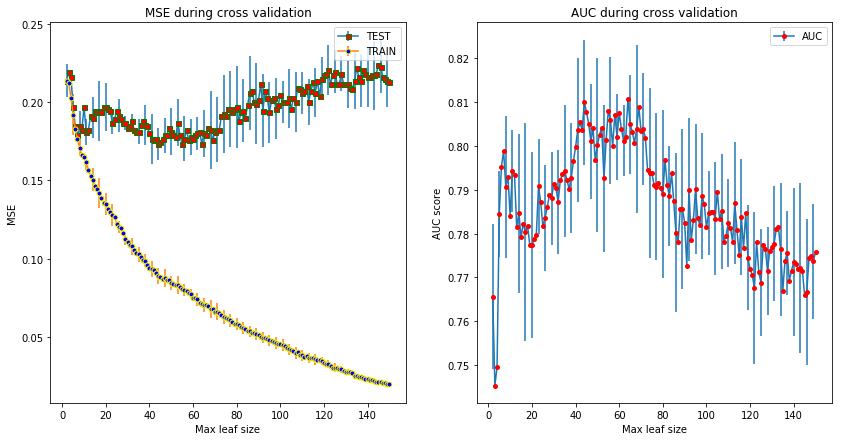
Leaf size 62 yields the best AUC score: 0.811
The five fold cross validation gives the result that 42 is the most appropiate number of leaves for this problem and it results in a 81% AUC score.
from sklearn.ensemble import ExtraTreesClassifier, GradientBoostingClassifier, RandomForestClassifier
from xgboost import XGBClassifier

from sklearn.model_selection import cross_val_score
def test_models(model, X, y):
    X_train, X_test, y_train, y_test = train_test_split(X, y, test_size=.2, shuffle=True, random_state=42)

    clf = model.fit(X_train, y_train)
    pred_train = clf.predict_proba(X_train)
    pred_test = clf.predict_proba(X_test)

    plt.figure(figsize=(20, 12))
    plt.subplot(221)
    fpr, tpr, _ = roc_curve(y_train, pred_train[:, 1])
    lw = 2
    plt.plot(fpr, tpr, color='darkorange',lw=lw, label="AUC = %.3f " % roc_auc_score(y_train, pred_train[:, 1]))
    plt.plot([0, 1], [0, 1], color='navy', lw=lw, linestyle='--')
    plt.xlim([0, 1.01])
    plt.ylim([0, 1.01])
    plt.xlabel('False Positive Rate')
    plt.ylabel('True Positive Rate')
    plt.legend(loc="lower right")
    plt.title("Training set")

    plt.subplot(222)
    fpr, tpr, _ = roc_curve(y_test, pred_test[:, 1])
    lw = 2
    plt.plot(fpr, tpr, color='darkorange',lw=lw, label="AUC = %.3f " % roc_auc_score(y_test, pred_test[:, 1]))
    plt.plot([0, 1], [0, 1], color='navy', lw=lw, linestyle='--')
    plt.xlim([0, 1.01])
    plt.ylim([0, 1.01])
    plt.xlabel('False Positive Rate')
    plt.ylabel('True Positive Rate')
    plt.legend(loc="lower right")
    plt.title("Test set")

    scores = []
    std_scores = []
    test_scores = []
    test_std_scores = []

    for depth in range(2, 30):
        clf.max_depth = depth
        X_train, X_test, y_train, y_test = train_test_split(X, y, test_size=.2, shuffle=True, random_state=42)
        this_scores = cross_val_score(clf, X_train, y_train, cv=5, n_jobs=1)
        scores.append(np.mean(this_scores))
        std_scores.append(np.std(this_scores))
        this_scores = cross_val_score(clf, X_test, y_test, cv=5, n_jobs=1)
        test_scores.append(np.mean(this_scores))
        test_std_scores.append(np.std(this_scores))

    plt.subplot(223)
    plt.title("Cross validation score")
    plt.xlabel("Max depth")
    plt.ylabel("Cross validation score")
    plt.errorbar(range(2, 30), scores, yerr=std_scores, marker='s', mfc='red',
                 mec='green', ms=5, mew=1, label = "TRAIN", errorevery=1)
    plt.legend()

    plt.subplot(224)
    plt.title("MSE during cross validation")
    plt.xlabel("Max depth")
    plt.ylabel("Cross validation score")
    plt.errorbar(range(2, 30), test_scores, yerr=test_std_scores, marker='o', mfc='blue',
                 mec='yellow', ms=5, mew=1, label = "TEST", errorevery=1)
    plt.legend()

plt.show()
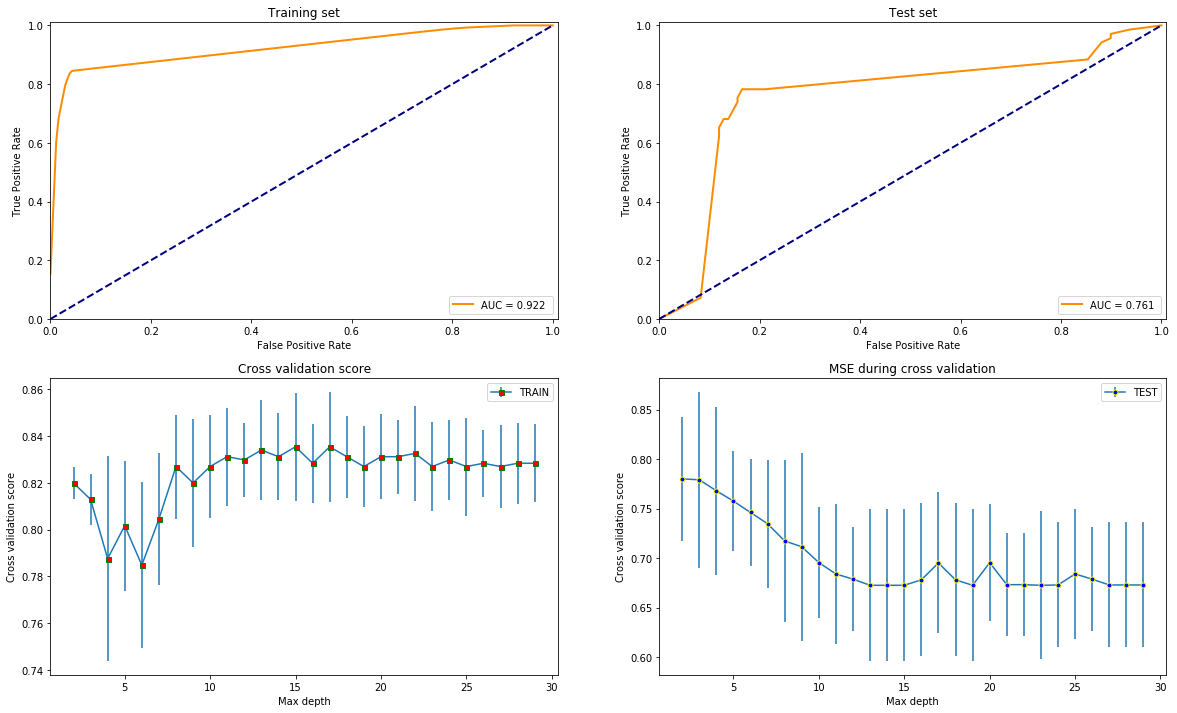
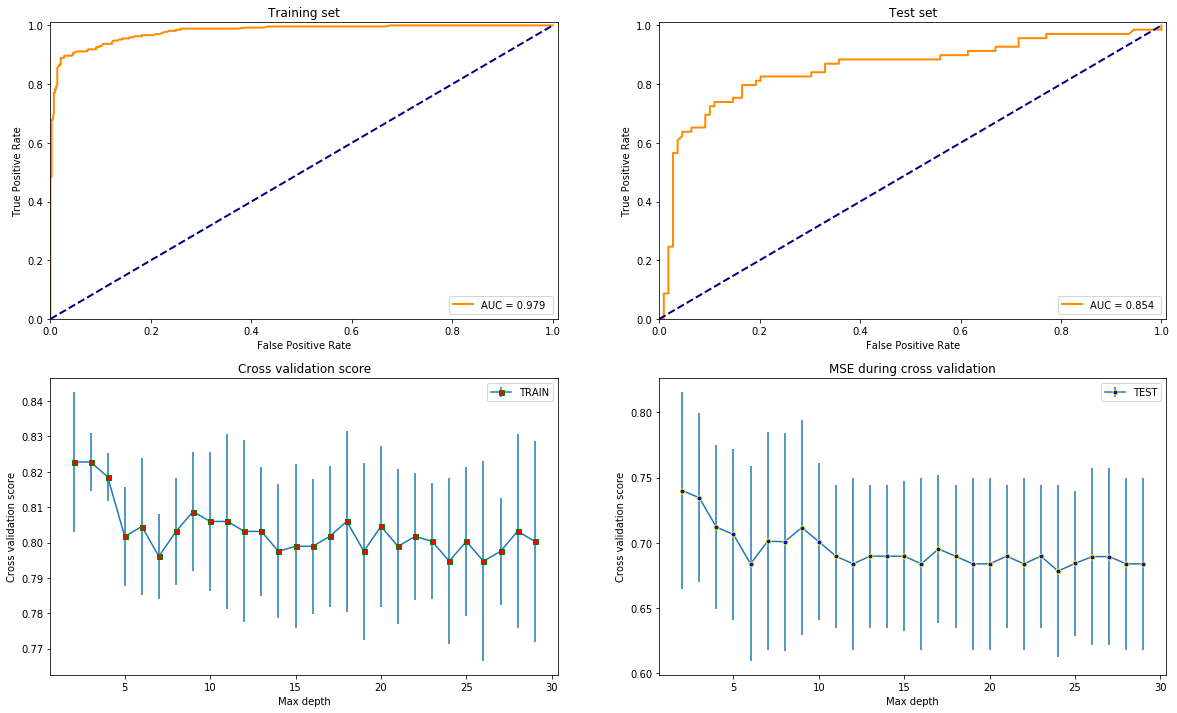
test_models(DecisionTreeClassifier(max_leaf_nodes=42), X, y)
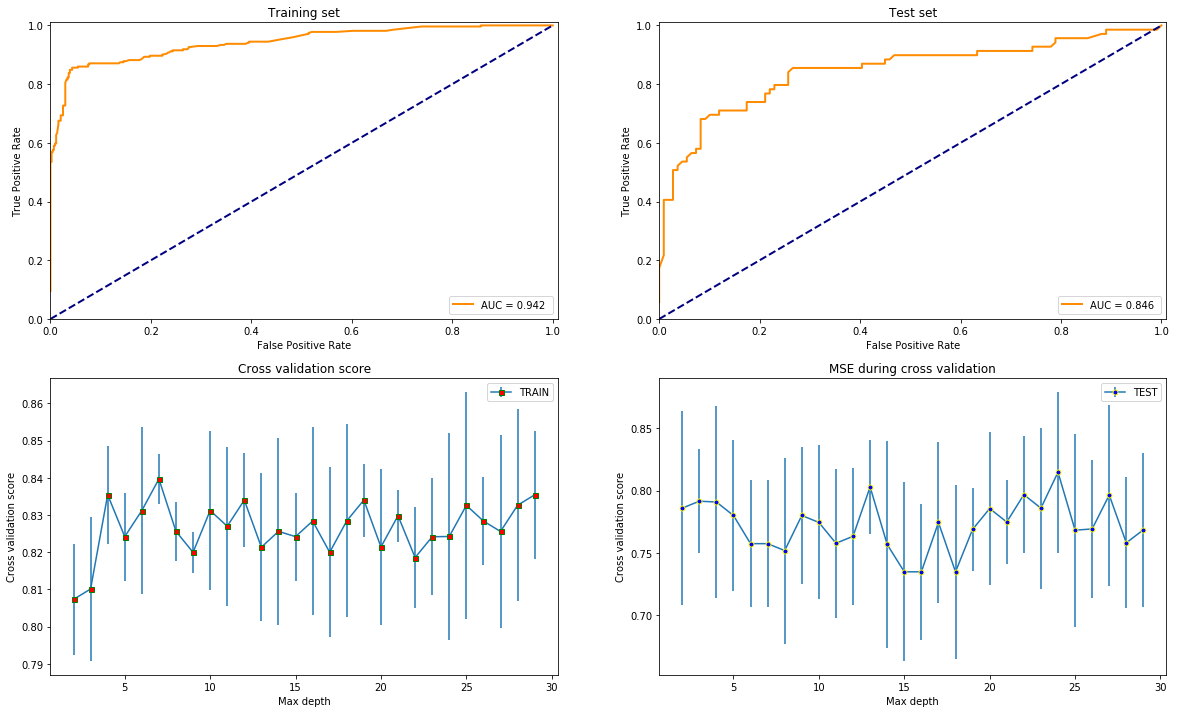
test_models(GradientBoostingClassifier(max_leaf_nodes=42), X, y)
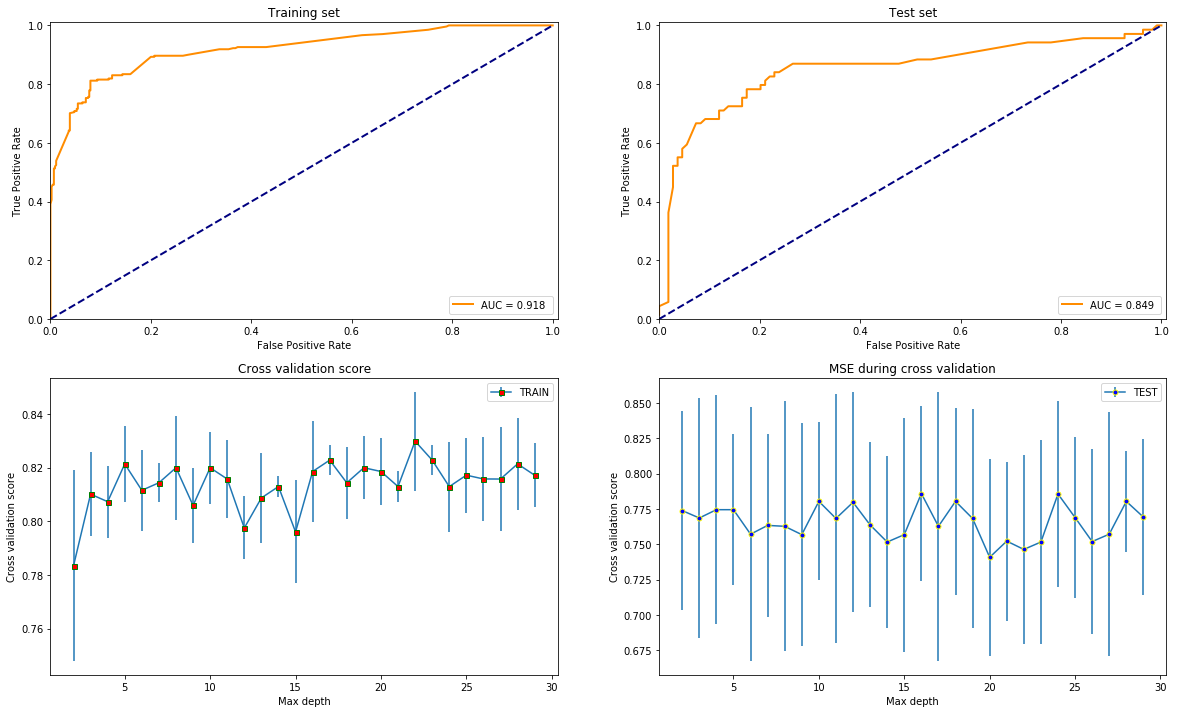
test_models(RandomForestClassifier(max_leaf_nodes=42), X, y)
clf = ExtraTreesClassifier(max_leaf_nodes=42)
test_models(clf, X, y)
import warnings
warnings.filterwarnings('ignore') # deprecation warning
test_models(XGBClassifier(), X, y)
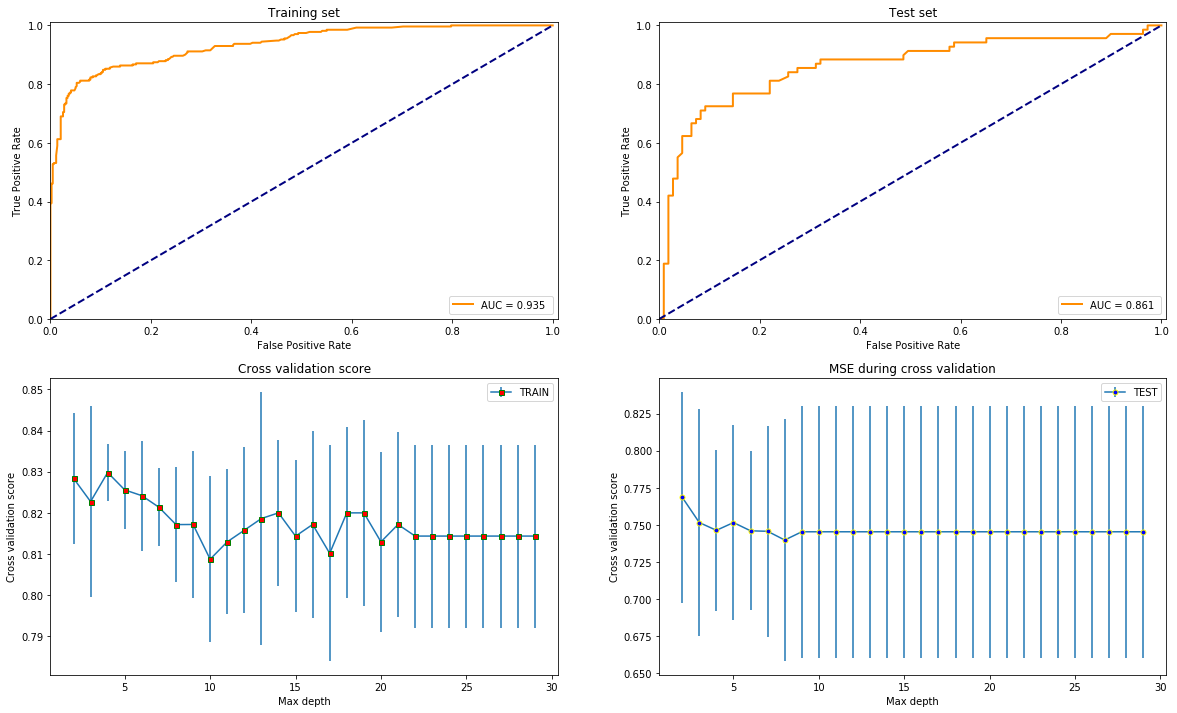
Overall, it seems like that XGBoost is the best option since it gives the highest AUC score and is most stable varying the depth since that is the only common parameter with the others what is reasonable to compare by.
Decision tree from scratch
Using sample code from Google ML tutorial and the video course where I have found this. I have made the code shorter and reorganized it.
header = np.append(X.columns, 'Survived')
X_train, X_test = train_test_split(np.append(X.values, y.values.reshape(-1, 1), axis=1),
                                   test_size=.2, shuffle=True, random_state=42)
X_train.shape, X_test.shape
((711, 7), (178, 7))
def unique_vals(rows, col):
    """Find the unique values for a column in a dataset."""
    return set([row[col] for row in rows])

def class_counts(rows):
    """Counts the number of each type of example in a dataset."""
    counts = {}  # a dictionary of label -> count.
    for row in rows:
        # in our dataset format, the label is always the last column
        label = row[-1]
        if label not in counts:
            counts[label] = 0
        counts[label] += 1
    return counts

def is_numeric(value):
    """Test if a value is numeric."""
    return isinstance(value, int) or isinstance(value, float)

class Question:
    """A Question is used to partition a dataset.

    This class just records a 'column number' (e.g., 0 for Color) and a
    'column value' (e.g., Green). The 'match' method is used to compare
    the feature value in an example to the feature value stored in the
    question. See the demo below.
    """

    def __init__(self, column, value):
        self.column = column
        self.value = value

    def match(self, example):
        # Compare the feature value in an example to the
        # feature value in this question.
        val = example[self.column]
        if is_numeric(val):
            return val >= self.value
        else:
            return val == self.value

    def __repr__(self):
        # This is just a helper method to print
        # the question in a readable format.
        condition = "=="
        if is_numeric(self.value):
            condition = ">="
        return "Is %s %s %s?" % (
            header[self.column], condition, str(self.value))

def partition(rows, question):
    """Partitions a dataset.

    For each row in the dataset, check if it matches the question. If
    so, add it to 'true rows', otherwise, add it to 'false rows'.
    """
    true_rows, false_rows = [], []
    for row in rows:
        if question.match(row):
            true_rows.append(row)
        else:
            false_rows.append(row)
    return true_rows, false_rows


def gini(rows):
    """Calculate the Gini Impurity for a list of rows.

    There are a few different ways to do this, I thought this one was
    the most concise. See:
    https://en.wikipedia.org/wiki/Decision_tree_learning#Gini_impurity
    """
    counts = class_counts(rows)
    impurity = 1
    for lbl in counts:
        prob_of_lbl = counts[lbl] / float(len(rows))
        impurity -= prob_of_lbl**2
    return impurity

def info_gain(left, right, current_uncertainty):
    """Information Gain.

    The uncertainty of the starting node, minus the weighted impurity of
    two child nodes.
    """
    p = float(len(left)) / (len(left) + len(right))
    return current_uncertainty - p * gini(left) - (1 - p) * gini(right)

def find_best_split(rows):
    """Find the best question to ask by iterating over every feature / value
    and calculating the information gain."""
    best_gain = 0  # keep track of the best information gain
    best_question = None  # keep train of the feature / value that produced it
    current_uncertainty = gini(rows)
    n_features = len(rows[0]) - 1  # number of columns

    for col in range(n_features):  # for each feature

        values = set([row[col] for row in rows])  # unique values in the column

        for val in values:  # for each value

            question = Question(col, val)

            # try splitting the dataset
            true_rows, false_rows = partition(rows, question)

            # Skip this split if it doesn't divide the
            # dataset.
            if len(true_rows) == 0 or len(false_rows) == 0:
                continue

            # Calculate the information gain from this split
            gain = info_gain(true_rows, false_rows, current_uncertainty)

            # You actually can use '>' instead of '>=' here
            # but I wanted the tree to look a certain way for our
            # toy dataset.
            if gain >= best_gain:
                best_gain, best_question = gain, question

    return best_gain, best_question


class Leaf:
    """A Leaf node classifies data.

    This holds a dictionary of class (e.g., "Apple") -> number of times
    it appears in the rows from the training data that reach this leaf.
    """

    def __init__(self, rows):
        self.predictions = class_counts(rows)


class Decision_Node:
    """A Decision Node asks a question.

    This holds a reference to the question, and to the two child nodes.
    """

    def __init__(self,
                 question,
                 true_branch,
                 false_branch):
        self.question = question
        self.true_branch = true_branch
        self.false_branch = false_branch
def build_tree(rows):
    """Builds the tree.

    Rules of recursion: 1) Believe that it works. 2) Start by checking
    for the base case (no further information gain). 3) Prepare for
    giant stack traces.
    """

    # Try partitioing the dataset on each of the unique attribute,
    # calculate the information gain,
    # and return the question that produces the highest gain.
    gain, question = find_best_split(rows)

    # Base case: no further info gain
    # Since we can ask no further questions,
    # we'll return a leaf.
    if gain == 0:
        return Leaf(rows)

    # If we reach here, we have found a useful feature / value
    # to partition on.
    true_rows, false_rows = partition(rows, question)

    # Recursively build the true branch.
    true_branch = build_tree(true_rows)

    # Recursively build the false branch.
    false_branch = build_tree(false_rows)

    # Return a Question node.
    # This records the best feature / value to ask at this point,
    # as well as the branches to follow
    # dependingo on the answer.
    return Decision_Node(question, true_branch, false_branch)
def print_tree(node, spacing=""):
    """World's most elegant tree printing function."""

    # Base case: we've reached a leaf
    if isinstance(node, Leaf):
        print (spacing + "Predict", node.predictions)
        return

    # Print the question at this node
    print (spacing + str(node.question))

    # Call this function recursively on the true branch
    print (spacing + '--> True:')
    print_tree(node.true_branch, spacing + "  ")

    # Call this function recursively on the false branch
    print (spacing + '--> False:')
    print_tree(node.false_branch, spacing + "  ")
my_tree = build_tree(X_train)
print_tree(my_tree)
Is Sex >= 1.0?
--> True:
  Is Fare >= 26.2875?
  --> True:
    Is SibSp >= 3.0?
    --> True:
      Is Age >= 4.0?
      --> True:
        Predict {0.0: 17}
      --> False:
        Is Age >= 3.0?
        --> True:
          Predict {1.0: 1}
        --> False:
          Predict {0.0: 4}
    --> False:
      Is Age >= 16.0?
      --> True:
        Is Fare >= 26.55?
        --> True:
          Is Age >= 25.0?
          --> True:
            Is Age >= 28.0?
            --> True:
              Is Pclass >= 3.0?
              --> True:
                Is Fare >= 56.4958?
                --> True:
  ...
def classify(row, node):
    """See the 'rules of recursion' above."""

    # Base case: we've reached a leaf
    if isinstance(node, Leaf):
        return node.predictions

    # Decide whether to follow the true-branch or the false-branch.
    # Compare the feature / value stored in the node,
    # to the example we're considering.
    if node.question.match(row):
        return classify(row, node.true_branch)
    else:
        return classify(row, node.false_branch)
def convert_leaf(counts):
    """A nicer way to print the predictions at a leaf."""
    total = sum(counts.values()) * 1.0
    probs = [0]*2
    probs[0] = 0
    probs[1] = 0
    for lbl in counts.keys():
        probs[int(lbl)] = counts[lbl] / total
    return probs
pred_test = []
for row in X_test:
    pred_test.append(convert_leaf(classify(row, my_tree)))
pred_test = np.array(pred_test)

pred_train = []
for row in X_train:
    pred_train.append(convert_leaf(classify(row, my_tree)))
pred_train = np.array(pred_train)
plt.figure(figsize=(16, 6))
plt.subplot(121)
fpr, tpr, _ = roc_curve(y_train, pred_train[:, 1])
lw = 2
plt.plot(fpr, tpr, color='darkorange',lw=lw, label="AUC = %.3f " % roc_auc_score(X_train[:, -1], pred_train[:, 1]))
plt.plot([0, 1], [0, 1], color='navy', lw=lw, linestyle='--')
plt.xlim([0, 1.01])
plt.ylim([0, 1.01])
plt.xlabel('False Positive Rate')
plt.ylabel('True Positive Rate')
plt.legend(loc="lower right")
plt.title("Training set")

plt.subplot(122)
fpr, tpr, _ = roc_curve(y_test, pred_test[:, 1])
lw = 2
plt.plot(fpr, tpr, color='darkorange',lw=lw, label="AUC = %.3f " % roc_auc_score(X_test[:, -1], pred_test[:, 1]))
plt.plot([0, 1], [0, 1], color='navy', lw=lw, linestyle='--')
plt.xlim([0, 1.01])
plt.ylim([0, 1.01])
plt.xlabel('False Positive Rate')
plt.ylabel('True Positive Rate')
plt.legend(loc="lower right")
plt.title("Test set")

plt.show()
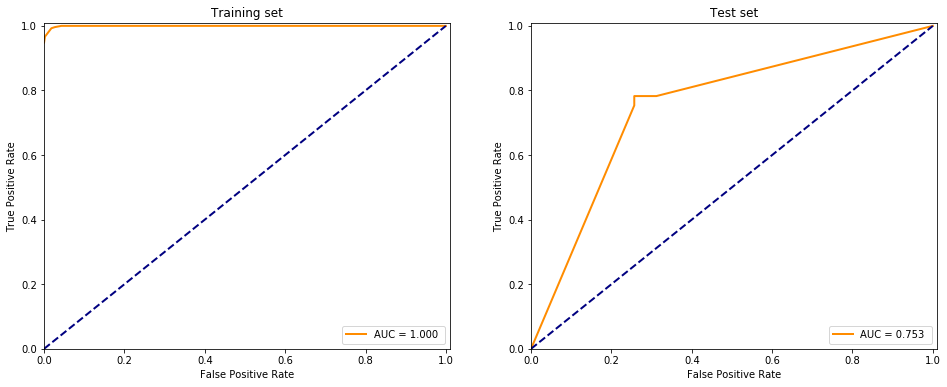
It is almost the same as the scikit learn package with default behaviour:
X_train, X_test, y_train, y_test = train_test_split(X, y, test_size=.2, shuffle=True, random_state=42)

clf = DecisionTreeClassifier().fit(X_train, y_train)

pred_train = clf.predict_proba(X_train)
pred_test = clf.predict_proba(X_test)

plt.figure(figsize=(16, 6))
plt.subplot(121)
fpr, tpr, _ = roc_curve(y_train, pred_train[:, 1])
lw = 2
plt.plot(fpr, tpr, color='darkorange',lw=lw, label="AUC = %.3f " % roc_auc_score(y_train, pred_train[:, 1]))
plt.plot([0, 1], [0, 1], color='navy', lw=lw, linestyle='--')
plt.xlim([0, 1.01])
plt.ylim([0, 1.01])
plt.xlabel('False Positive Rate')
plt.ylabel('True Positive Rate')
plt.legend(loc="lower right")
plt.title("Training set")

plt.subplot(122)
fpr, tpr, _ = roc_curve(y_test, pred_test[:, 1])
lw = 2
plt.plot(fpr, tpr, color='darkorange',lw=lw, label="AUC = %.3f " % roc_auc_score(y_test, pred_test[:, 1]))
plt.plot([0, 1], [0, 1], color='navy', lw=lw, linestyle='--')
plt.xlim([0, 1.01])
plt.ylim([0, 1.01])
plt.xlabel('False Positive Rate')
plt.ylabel('True Positive Rate')
plt.legend(loc="lower right")
plt.title("Test set")

plt.show()
@Regards, Alex

Alex Olar
Christian, foodie, physicist, tech enthusiast