
The first baby-steps in data scince
- 14 minsLab excercise 1/1. Unsupervised learning / clustering.
- Get data
- A. Download the data from the article * “Hurricane-induced selection on the morphology of an island lizard”*.
- https://www.nature.com/articles/s41586-018-0352-3
- A. Download the data from the article * “Hurricane-induced selection on the morphology of an island lizard”*.
- PCA
- A. Perform PCA on meaningful lizard body measurement data.
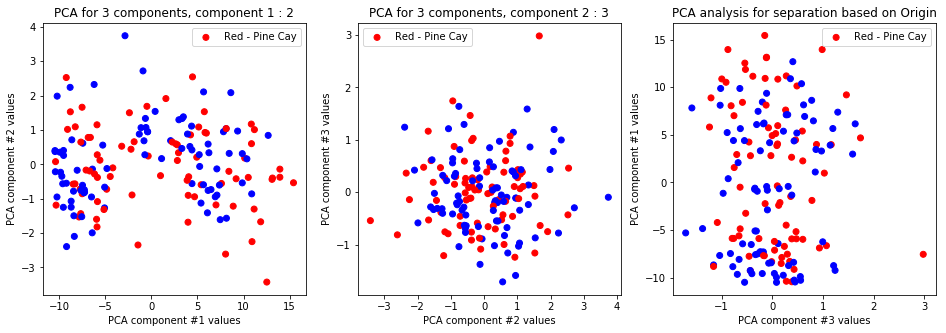
- B. Plot, and interpret the first 3 components using the descriptive labels (‘Origin’, ‘Sex’, ‘Hurricane’).
- T-SNE
- A. Perform T-SNE on meaningful lizard body measurement data.
- B. Plot, and interpret the emerging clusters using the descriptive labels (‘Origin’, ‘Sex’, ‘Hurricane’).
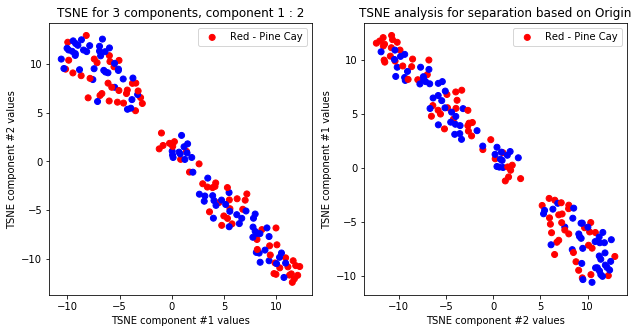
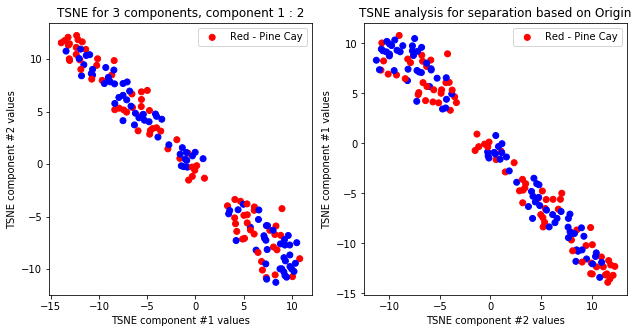
- C. Repeat T-SNE 3 times using random seeds (0,1,2) and compare them visually.
- D. Try T-SNE using 3 components too, do new clusters emerge which explain other descriptive labels?
- K-means
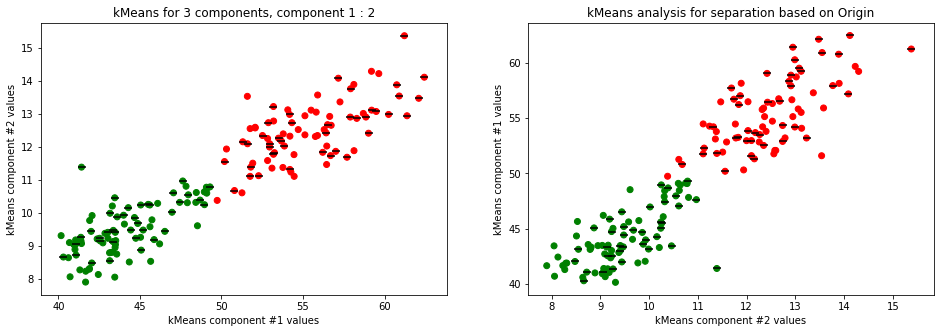
- A. Perform K-means clustering on meaningful lizard body measurement data with 2 clusters.
- B. Interpret the clusters using the descriptive labels (‘Origin’, ‘Sex’, ‘Hurricane’).
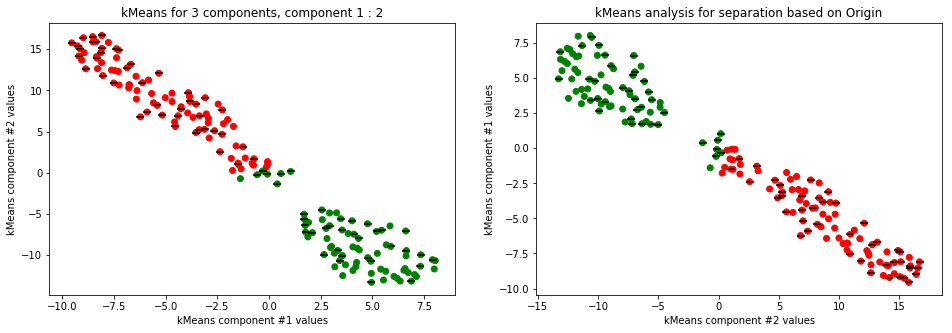
- C. Repeat A and B in the 2D T-SNE embedding space.
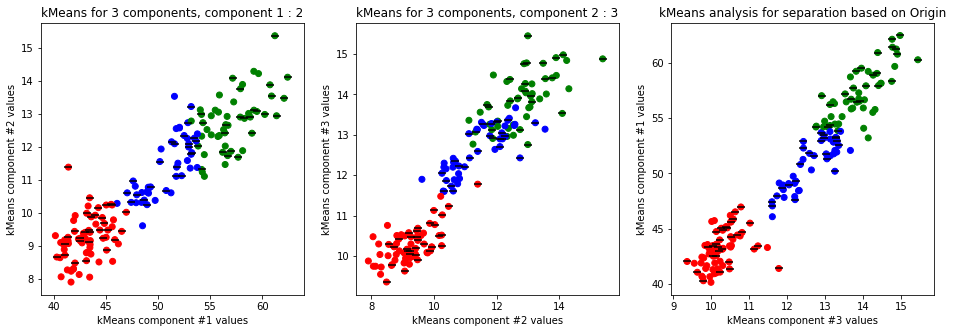
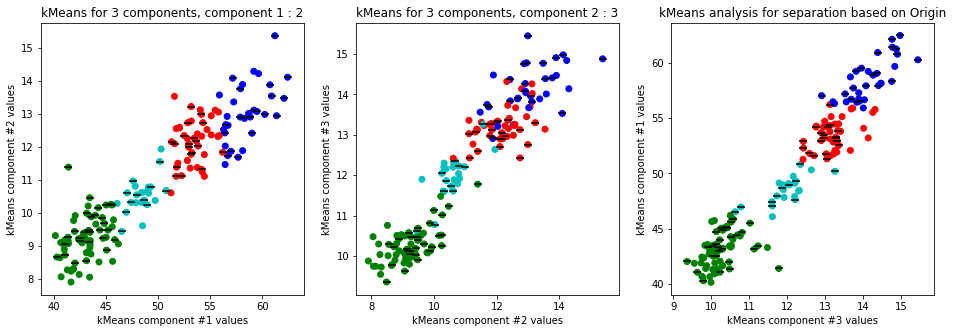
- D. Perform K-means clustering on the original data with 3 and 4 clusters. Assess visually the meaning of clusters in the 2D space of the 1st and 3rd PCA component. What is the relationship between the clusters and the descriptive labels?
- Hierarchical clustering
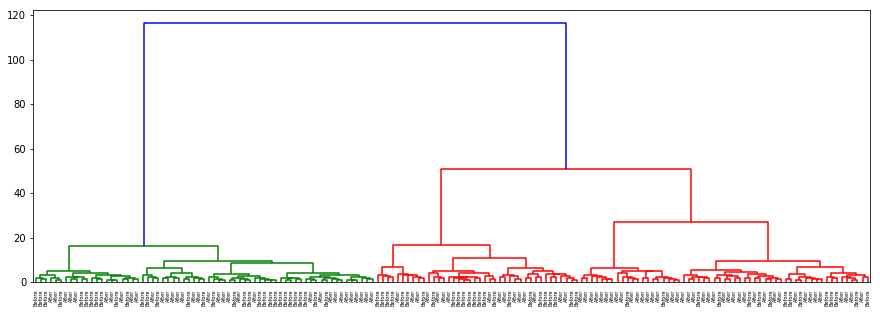
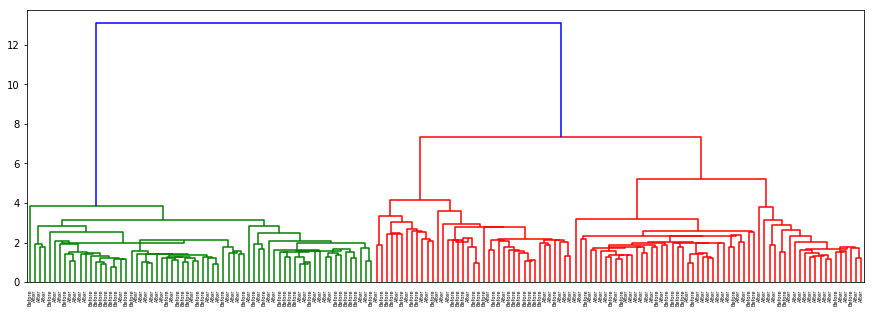
- A. Perform hierarchical clustering on meaningful lizard body measurement data. Show the results on a dendrogram.
- B. Interpret the dendrogram using the descriptive labels (‘Origin’, ‘Sex’, ‘Hurricane’).
import numpy as np
import pandas as pd
import sklearn
from sklearn.decomposition import PCA
from sklearn.preprocessing import Imputer
import matplotlib.pyplot as plt
dataset = pd.read_csv("Donihue 2018-01-00672 Hurricanes Data.csv")
sex = dataset['Sex']
origin = dataset['Origin']
hurricane = dataset['Hurricane']
# convert to array
data = dataset.values
# extract numbers
data = data[:, [i for i in range(4,dataset.columns.size - 3)]]
imputer = Imputer()
data = imputer.fit_transform(data, y=None)
pca = PCA(n_components=3, svd_solver='full')
pca.fit(data)
transformedData = pca.transform(data)
- the imputer is needed to normalize data points such as
NaNor empty option with avarage to not pollute data
def createPlots(arr, name):
    plt.figure(figsize=(16,5))

    for i in range(0,3):
        subplt = plt.subplot(int("13%d" % (i + 1)))
        subplt.scatter(transformedData[:, i % 3], transformedData[:, (i+1) % 3],
                       color=['r' if s == arr.values[0] else 'b' for s in arr.values])
        subplt.set_title("PCA for 3 components, component %d : %d" % (i % 3 + 1, (i+1) % 3 + 1))
        subplt.set_xlabel('PCA component #%d values' % (i%3 + 1))
        subplt.set_ylabel('PCA component #%d values' % ((i+1)%3 + 1))
        subplt.legend(['Red - %s' % arr.values[0]])

    plt.title("PCA analysis for separation based on %s" % name)
    plt.savefig('PCAfor%s.png' % name, dpi=80)
createPlots(sex, 'Gender')
createPlots(hurricane, 'Hurricane')
createPlots(origin, 'Origin')


-
The first and second and first and third PCA components differentiate on gender only and nothing else. Other labels and configurations don’t provide meaningful data.
from sklearn.manifold import TSNE
transformedData = TSNE(n_components=2).fit_transform(data)
def createPlots(arr, name):
    plt.figure(figsize=(16,5))

    for i in range(0,2):
        subplt = plt.subplot(int("13%d" % (i + 1)))
        subplt.scatter(transformedData[:, i % 2], transformedData[:, (i+1) % 2],
                       color=['r' if s == arr.values[0] else 'b' for s in arr.values])
        subplt.set_title("TSNE for 3 components, component %d : %d" % (i % 2 + 1, (i+1) % 2 + 1))
        subplt.set_xlabel('TSNE component #%d values' % (i%2 + 1))
        subplt.set_ylabel('TSNE component #%d values' % ((i+1)%2 + 1))
        subplt.legend(['Red - %s' % arr.values[0]])

    plt.title("TSNE analysis for separation based on %s" % name)
    plt.savefig('TSNEfor%s.png' % name, dpi=80)

createPlots(sex, 'Gender')
createPlots(hurricane, 'Hurricane')
createPlots(origin, 'Origin')


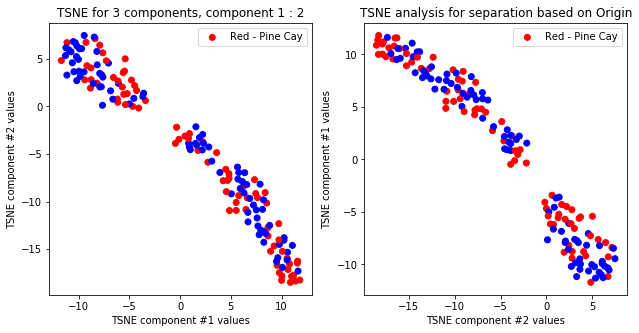
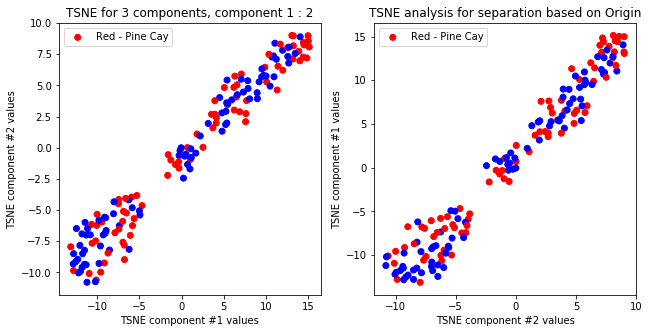
TSNE not accurately, but visibly differentiates on gender comparing all components but there is no separation for anything else.
## With different random seed
def tsne_with_random_seed(data, seed, comp):
    transformedData = TSNE(n_components=comp, random_state=seed).fit_transform(data)
    def createPlots(arr, name):
        plt.figure(figsize=(16,5))

        for i in range(0,comp):
            subplt = plt.subplot(int("13%d" % (i + 1)))
            subplt.scatter(transformedData[:, i % comp], transformedData[:, (i+1) % comp],
                           color=['r' if s == arr.values[0] else 'b' for s in arr.values])
            subplt.set_title("TSNE for 3 components, component %d : %d" % (i % comp + 1, (i+1) % comp + 1))
            subplt.set_xlabel('TSNE component #%d values' % (i%comp + 1))
            subplt.set_ylabel('TSNE component #%d values' % ((i+1)%comp + 1))
            subplt.legend(['Red - %s' % arr.values[0]])

        plt.title("TSNE analysis for separation based on %s" % name)
        plt.savefig('TSNEfor%s%dComponentsRandomSeed%d.png' % (name, comp, seed), dpi=80)

    createPlots(sex, 'Gender')
    createPlots(hurricane, 'Hurricane')
    createPlots(origin, 'Origin')

tsne_with_random_seed(data, 0, 2)


tsne_with_random_seed(data, 1, 2)


tsne_with_random_seed(data, 2, 2)


tsne_with_random_seed(data, 0, 3)


tsne_with_random_seed(data, 1, 3)


tsne_with_random_seed(data, 2, 3)


-
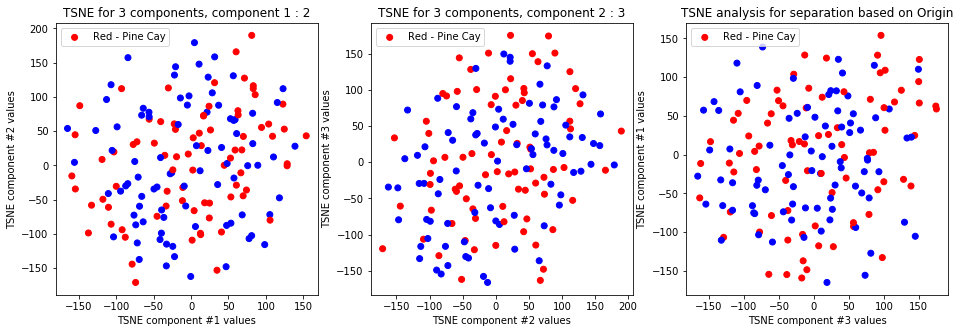
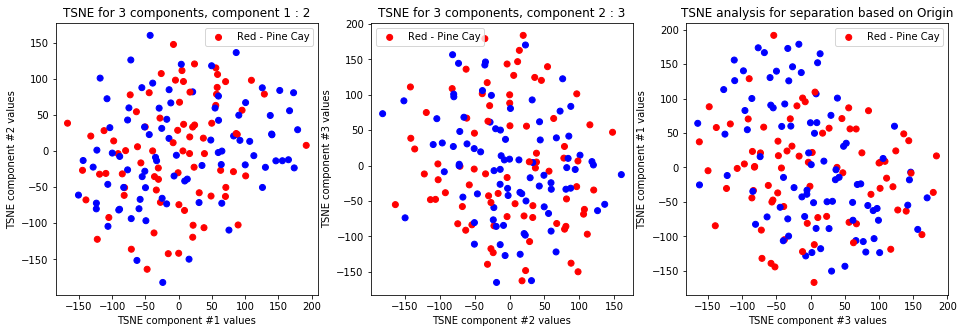
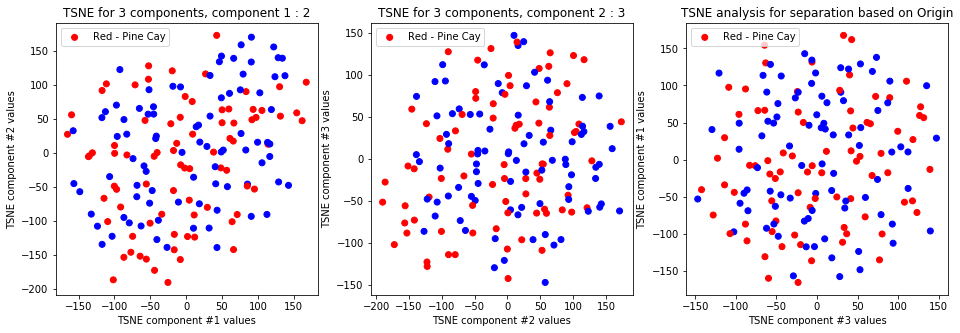
TSNE clearly separetes for gender for each component pair but not for anything else. Using more components this separation is maintained but gets more blurred, new clusters do not emerge.
from sklearn.cluster import KMeans
def kmeans_plot(clust, data):
    kmeans = KMeans(n_clusters=clust).fit(data)
    transformedData = data
    def createPlots(arr, name):
        plt.figure(figsize=(16,5))

        plotRange = clust if clust < 4 else 3

        colors = ['r', 'g', 'b', 'c']

        for i in range(0,plotRange):
            subplt = plt.subplot(int("1%d%d" % (plotRange, i + 1)))
            subplt.scatter(transformedData[:, i % plotRange], transformedData[:, (i+1) % plotRange],
                           color=[colors[x] for x in kmeans.predict(data)])
            for j in range(0, transformedData.shape[0]):
                if(arr.values[j] == arr.values[0]):
                    subplt.scatter(transformedData[j, i % plotRange], transformedData[j, (i+1) % plotRange],
                                    color='#000000' ,s=66, marker="_")
            subplt.set_title("kMeans for 3 components, component %d : %d" % (i % plotRange + 1, (i+1) % plotRange + 1))
            subplt.set_xlabel('kMeans component #%d values' % (i % plotRange + 1))
            subplt.set_ylabel('kMeans component #%d values' % ((i+1) % plotRange + 1))

        plt.title("kMeans analysis for separation based on %s" % name)
        plt.savefig('kMeansfor%s%dClusters.png' % (name, clust), dpi=80)

    createPlots(sex, 'Gender')
    createPlots(hurricane, 'Hurricane')
    createPlots(origin, 'Origin')
kmeans_plot(2, data)


kmeans_plot(2, TSNE(n_components=2).fit_transform(data))


kmeans_plot(3, data)


kmeans_plot(4, data)


-
Clear separation on gender, with more clusters new clusters emerge within males (males - black lines on dots) but there is not clustering amongst females. This might suggest different male sizes but maybe nothing, it os not very descriptive.
from scipy.cluster import hierarchy
def dendogram(label_arr, data, method='ward', desc=''):
    transformedData = hierarchy.linkage(data, method)
    plt.figure(figsize=(15,5))
    def llf(x):
        return label_arr[x]
    dn = hierarchy.dendrogram(transformedData[:,0:4], leaf_label_func=llf)
    plt.savefig('dendogram%sWithMethod%s.png' % (desc, method) )
dendogram(sex, data, desc='Gender')
dendogram(origin, data, desc='Origin')
dendogram(hurricane, data, desc='Hurricane')


dendogram(sex, data, 'centroid', 'Gender')
dendogram(origin, data, 'centroid', 'Origin')
dendogram(hurricane, data, 'centroid', 'Hurricane')


-
There is no separation for origin or hurricane as well as in the previous cases. In gender with ‘ward’ method which clusters on nearest distance (almost as kNN) and with ‘centroid’ almost the same results are acquired: separation on sex is clear and evident.
